
Introduction
Markets rarely move in straight lines. Prices rise, fall, and sometimes stall before making their next big move. One of the most fascinating signals traders watch for during a market downturn is the triple bottom pattern, a formation that often hints at a potential bullish reversal.
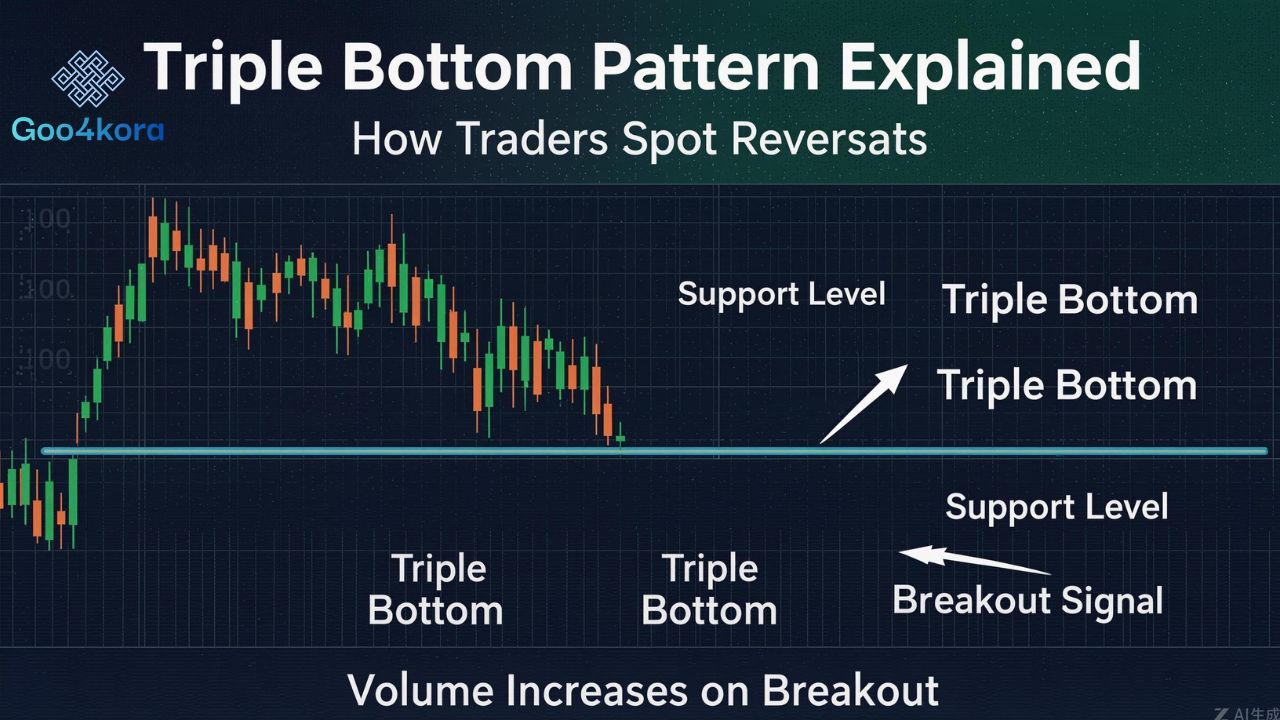
The triple bottom pattern appears when a financial asset tests the same support level three times without breaking below it. For traders and investors, this behavior suggests that sellers are losing momentum and buyers may soon regain control.
Understanding this pattern matters because it can help traders identify opportunities before a trend reversal becomes obvious to everyone else. When recognized correctly, it can mark the transition from bearish sentiment to a fresh bullish trend.
In this guide, we’ll explore how the triple bottom pattern works, why it forms, and how traders use it in real-world trading strategies.
What Is the Triple Bottom Pattern


The triple bottom pattern is a bullish chart pattern that forms after a prolonged downtrend. It occurs when price tests a strong support level three separate times but fails to break below it.
Each time the price touches that support zone, buyers step in and push the price upward again. Over time, this repeated rejection signals that selling pressure is weakening.
The pattern typically forms over several weeks or months and is considered one of the most reliable reversal signals in technical analysis.
Basic Characteristics
A triple bottom pattern usually includes:
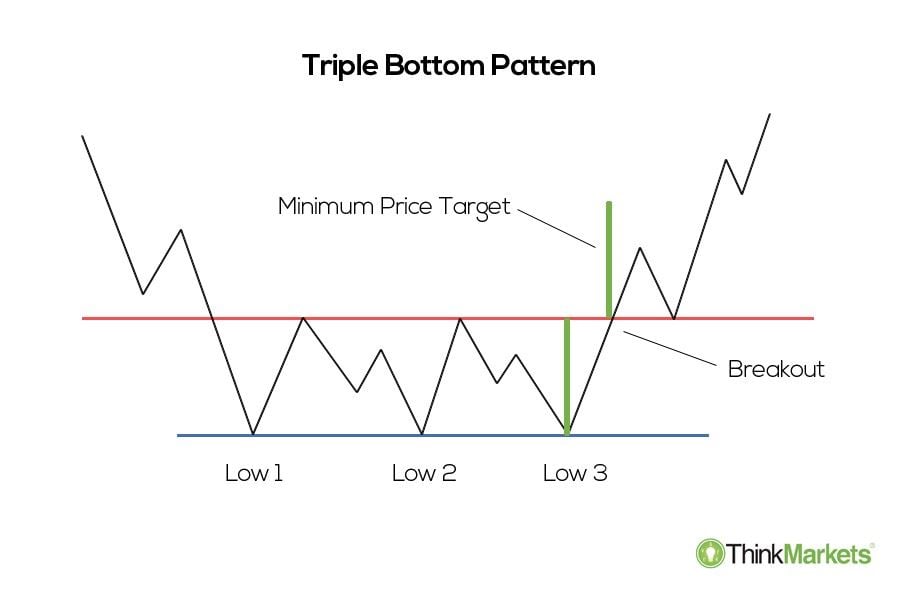
- Three nearly equal lows
- A horizontal support level
- A resistance level called the neckline
- A breakout above resistance confirming the reversal
Once price breaks above the neckline with strong volume, traders often interpret it as confirmation that a new uptrend may begin.
Psychology Behind the Triple Bottom Pattern
Understanding trader psychology helps explain why this pattern forms in the first place.
First Bottom
After a significant downtrend, the market reaches a price level where buyers believe the asset is undervalued. They begin purchasing, pushing the price upward.
Second Bottom
However, bearish sentiment remains strong. Sellers return and push the price downward again, retesting the same support level.
When the price bounces again, confidence slowly starts building among buyers.
Third Bottom
The third test is crucial. By this point:
- Sellers struggle to break the support level
- Buyers become more aggressive
- Market sentiment begins shifting
When the price eventually breaks resistance, it signals that buyers have gained control.
Structure and Key Components
A typical triple bottom pattern includes several structural elements that traders analyze.
1. Support Level
This is the price area where the asset repeatedly stops falling. It acts as a strong demand zone where buyers consistently enter the market.
2. Three Price Troughs
The defining feature of the pattern is three distinct lows. These troughs should appear roughly at the same price level.
3. Neckline Resistance
The neckline is the resistance level connecting the highs between the troughs.
When price breaks above this level, the pattern becomes valid.
4. Breakout
The breakout is the final confirmation of the pattern.
It usually occurs with:
- Strong bullish candles
- Increased trading volume
- Momentum indicators turning positive
Once the breakout occurs, traders often anticipate a new upward trend.
How to Identify a Triple Bottom Pattern
Recognizing a triple bottom pattern requires patience and careful observation.
Step-by-Step Identification
- Look for a clear downtrend
The pattern must appear after a declining market. - Identify the first bottom
Price forms a low and rebounds. - Observe the second bottom
Price returns to the same support area. - Confirm the third bottom
A third test of support occurs without a breakdown. - Wait for the breakout
Price moves above the neckline resistance.
Ideal Time Frames
The pattern can appear in multiple markets:
- Stocks
- Forex
- Cryptocurrency
- Commodities
Common time frames include:
- Daily charts
- Weekly charts
- 4-hour charts for swing traders
Longer time frames typically produce more reliable signals.
Triple Bottom vs Double Bottom Pattern
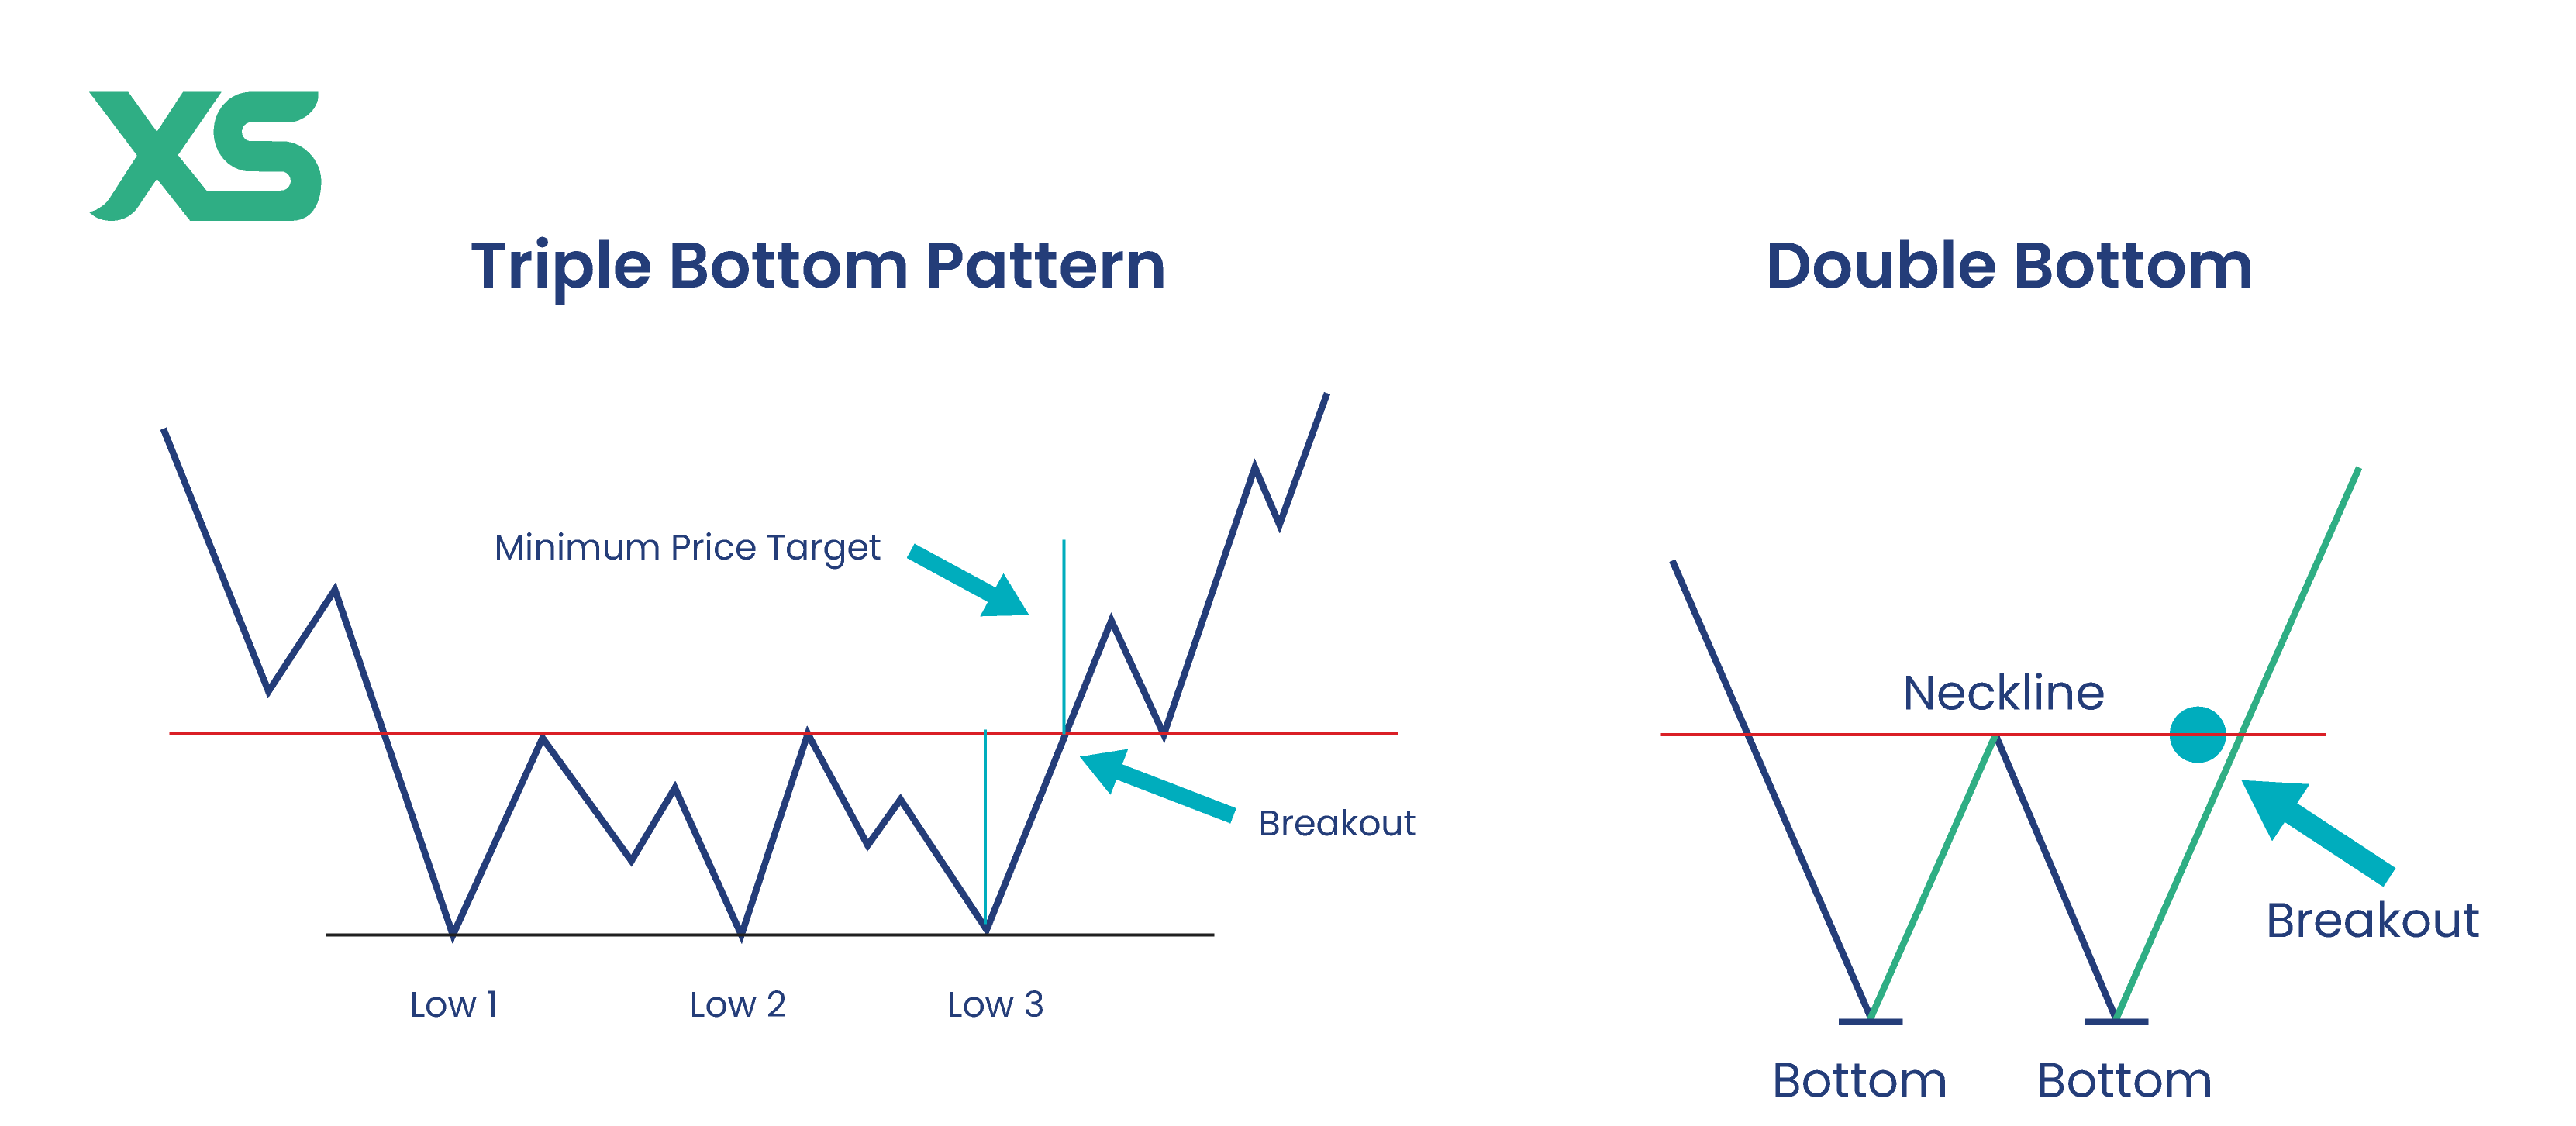
Many traders confuse the triple bottom with another well-known reversal pattern: the double bottom.
Key Differences
| Feature | Double Bottom | Triple Bottom |
|---|---|---|
| Number of lows | Two | Three |
| Formation time | Shorter | Longer |
| Strength | Moderate | Stronger confirmation |
| Reliability | High | Often higher |
Because the triple bottom involves three tests of support, it often signals stronger buying pressure.
Trading Strategies Using the Triple Bottom Pattern
Once traders confirm a triple bottom pattern, several strategies can be applied.
Breakout Strategy
This is the most common approach.
Steps:
- Wait for price to break above the neckline
- Confirm the breakout with volume
- Enter a long position
Pullback Entry
Sometimes price retests the neckline after breaking it.
This provides:
- Lower risk entry
- Better risk-reward ratio
Target Price Strategy
Traders often measure the pattern height.
Formula:
Target Price = Neckline + (Neckline – Support)
For example:
If support is $50 and neckline is $60:
Target = $60 + $10 = $70
Confirmation Signals Traders Use
Experienced traders rarely rely on one pattern alone. They combine the triple bottom pattern with other indicators.
Popular Confirmation Tools
1. Volume
Increasing volume during breakout strengthens the signal.
2. RSI (Relative Strength Index)
RSI above 50 suggests growing bullish momentum.
3. Moving Averages
Price crossing above the 50-day or 200-day moving average adds confirmation.
4. MACD Indicator
A bullish MACD crossover often accompanies breakouts.
Using multiple signals reduces the risk of false breakouts.
Real Market Examples
The triple bottom pattern appears frequently in global financial markets.
Stock Market Example
Many large-cap stocks have historically formed triple bottoms before major rallies. For example:
During market corrections, investors often defend key price levels multiple times before sentiment shifts.
Cryptocurrency Markets
Crypto traders frequently observe this pattern due to market volatility.
For instance:
Bitcoin has historically tested strong support zones multiple times before major bull runs.
Forex Markets
Currency pairs such as EUR/USD and GBP/USD often produce triple bottoms during macroeconomic shifts.
These patterns help traders anticipate long-term reversals.
Common Mistakes Traders Make
Despite its reliability, traders sometimes misuse the pattern.
Entering Too Early
Many traders jump in before the breakout.
Without confirmation, the pattern may fail.
Ignoring Volume
Low-volume breakouts often lead to false signals.
Misidentifying the Pattern
Sometimes price fluctuations resemble a triple bottom but lack:
- Equal support levels
- Clear neckline resistance
Careful chart analysis is essential.
Advantages and Limitations
Advantages
- Strong bullish reversal signal
- Works across many markets
- Easy visual recognition
- Useful for long-term trading
Limitations
- Takes time to form
- False breakouts can occur
- Requires confirmation from indicators
Like any technical tool, it should be part of a broader trading strategy.
FAQ
What does a triple bottom pattern indicate?
The triple bottom pattern signals a potential bullish reversal after a downtrend. It suggests that selling pressure is weakening and buyers are gaining control.
Is the triple bottom pattern reliable?
Yes, many traders consider it a reliable reversal pattern, especially when confirmed with volume and other technical indicators.
How long does a triple bottom pattern take to form?
It can take weeks or even months to develop depending on the market and time frame.
What happens after a triple bottom breakout?
After the breakout, price often enters a new upward trend as market sentiment shifts from bearish to bullish.
Can the triple bottom pattern fail?
Yes. If price falls below the support level instead of breaking above resistance, the pattern becomes invalid.
What indicators work best with the pattern?
Common confirmation tools include:
- RSI
- MACD
- Moving averages
- Volume analysis
Is the triple bottom pattern used in crypto trading?
Yes. The pattern appears frequently in cryptocurrency markets due to high volatility and repeated support tests.
What is the difference between triple bottom and head and shoulders?
The head and shoulders pattern signals a bearish reversal, while the triple bottom pattern signals a bullish reversal.
Conclusion
The triple bottom pattern stands out as one of the most powerful reversal signals in technical analysis. By showing repeated support tests and weakening selling pressure, it offers traders valuable insight into shifting market sentiment.
However, no pattern guarantees success. The most effective traders combine the triple bottom pattern with volume analysis, indicators, and sound risk management.
When used carefully, this pattern can help traders recognize the moment when a falling market finally runs out of sellers—and buyers begin to take control.